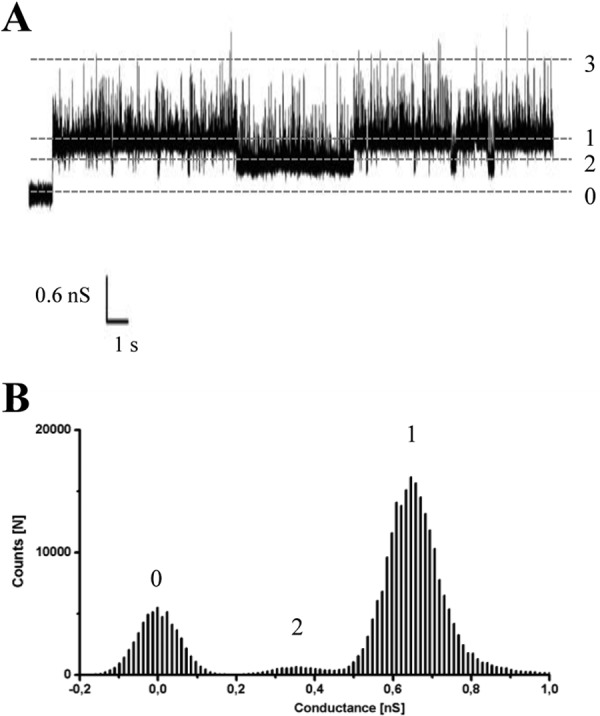
FIGURE 5.

Typical conductance through a single B. burgdorferi P13 channel (1 m KCl and 50 mV of applied voltage). A, recording of a single P13 channel in a solvent-free DPhPC membrane. The different conductance states are indicated by the dashed lines. B, histogram summarizing its conductance from a 200-s measurement (400 μs sampling rate). The conductance state 3 is not appreciable in the histogram because the time in this conformation is very low in comparison with states 1 and 2. State 0 corresponds to the membrane with no pore inserted upon which a 50-mV voltage was already applied.
