
FIGURE 7.
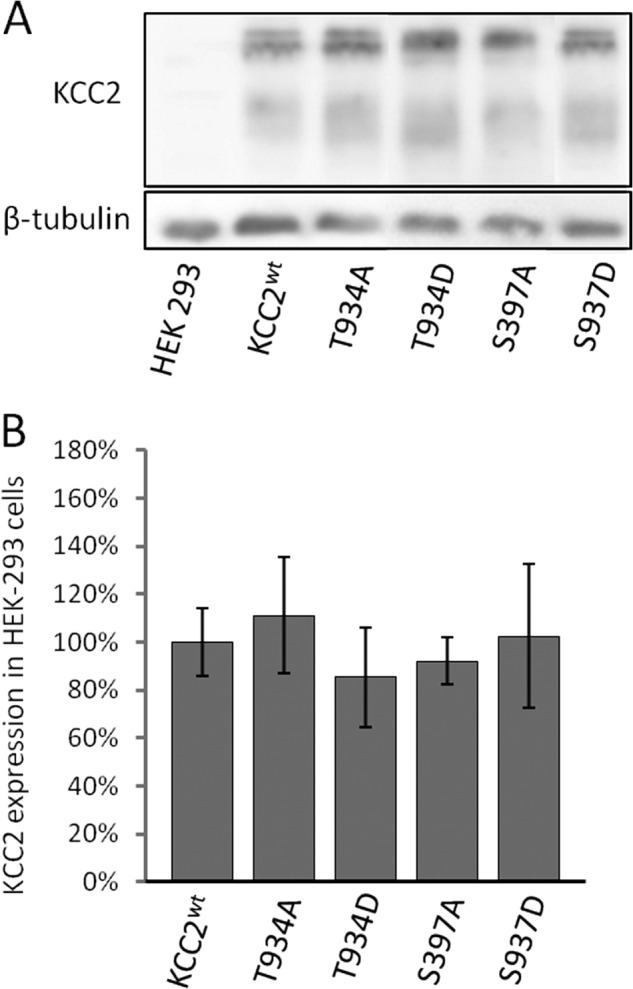
Immunoblot analysis of KCC2WT, KCC2T934A/T934D, and KCC2S937A/S937D. A, KCC2 constructs were transfected into HEK-293 cells, and proteins were isolated 36 h later. 10 μg of protein were loaded onto a 10% SDS-polyacrylamide gel system, and the amount of KCC2 was determined by immunoblotting using an anti-cKCC2 antibody. KCC2-IR was detected for KCC2WT and KCC2 mutants, but not for mock-transfected cells, whereas β-tubulin, serving as a loading control, was present in all lanes. The figure shows one experiment out of three biological replicates with similar results. B, KCC2 bands were quantified and normalized to the expression of β-tubulin. This revealed no differences in the expression level between KCC2WT and KCC2 mutants in HEK-293 cells. Graphs represent mean ± S.E. of three independent experiments.