
FIGURE 2.
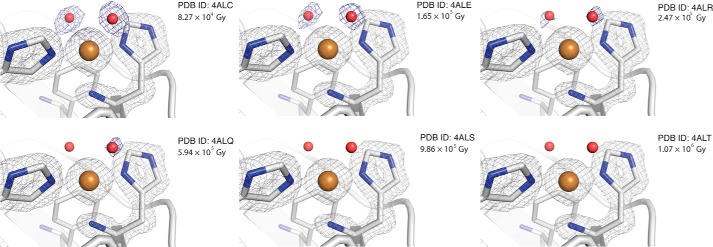
Close up view of the catalytic centers of EfaCBM33A at different levels of x-ray exposure. The blue omit-calculated 2mFo − Fc maps (52) are contoured at 0.87 e/Å3, the gray 2Fo − Fc maps are contoured at 0.89 e/Å3. The red oxygen-atom coordinates are taken from the 4ALC structure, are placed throughout the series for reference, and were not used in the calculation of the 2mFo − Fc omit maps. The structural images are labeled by the PDB codes and the dose of x-ray exposure.