
FIGURE 4.
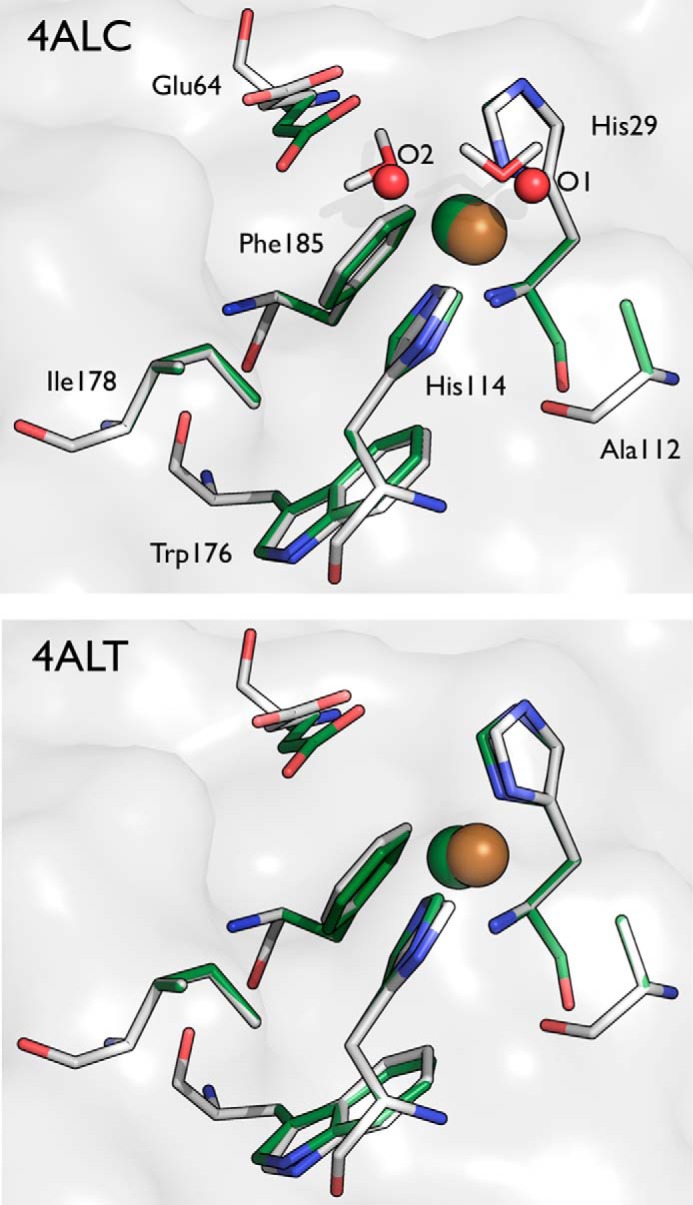
Comparison of the crystallographically determined active sites of 4ALC (top panel) and 4ALT (bottom panel) with quantum mechanically optimized active site models. The residues in gray (carbon), blue (nitrogen), and red (oxygen) represent the crystal structures, and the residues shown in green represent the geometry optimized structures from the DFT calculations. The copper is colored gold and green, respectively. The water molecules from the crystal structure are shown as red spheres in 4ALC, and the optimized water molecules are shown in stick format.