
FIGURE 8.
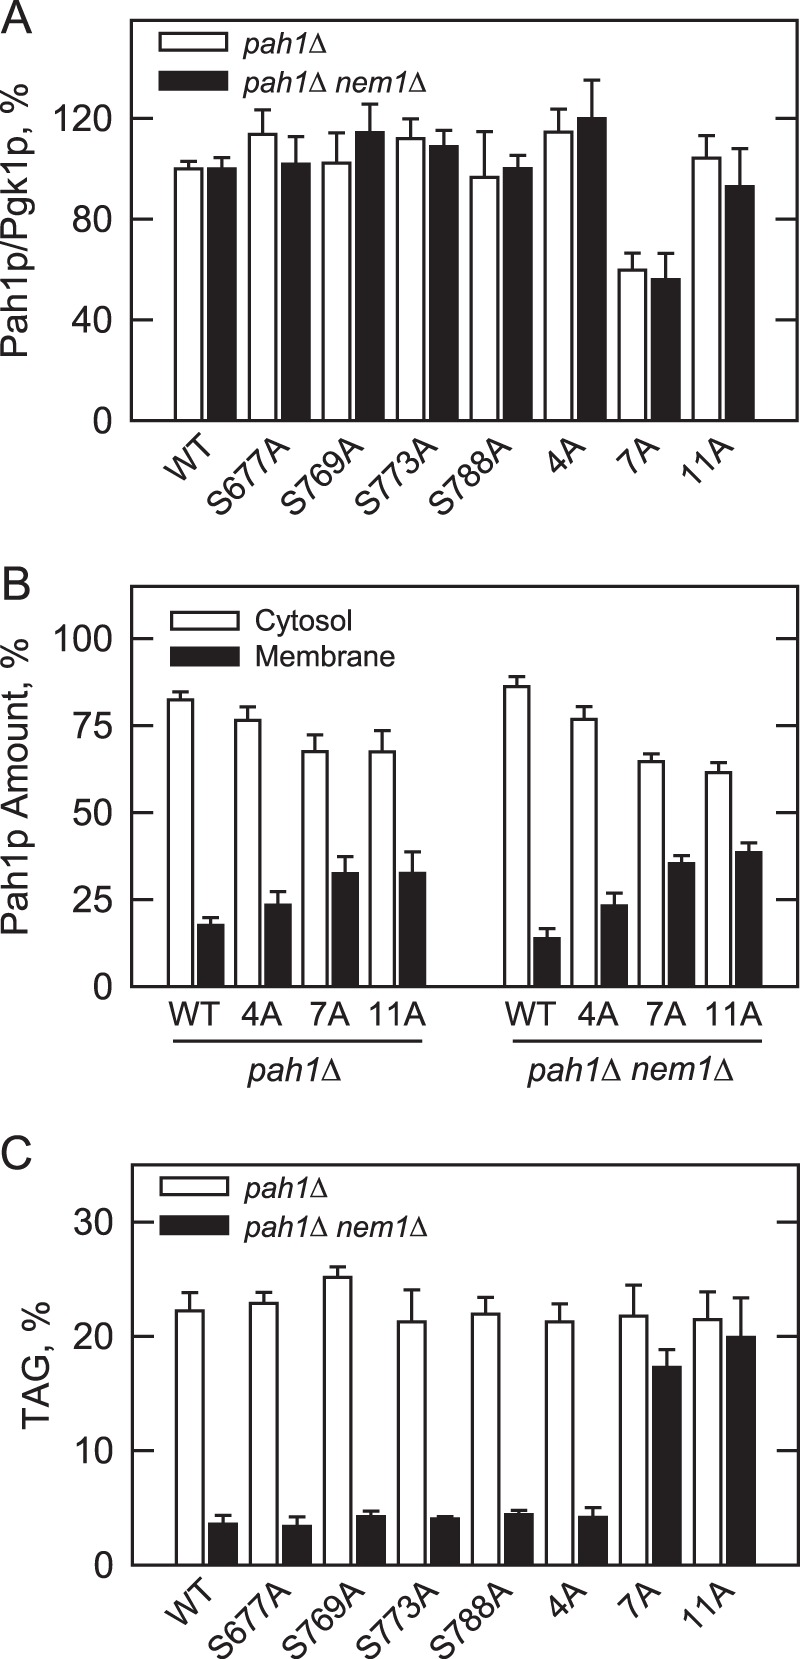
Effects of the PKC and Pho85p-Pho80p phosphorylation site mutations on the abundance and location of Pah1p and TAG content. The indicated wild type and phosphorylation site mutant forms of Pah1p were expressed in pah1Δ and pah1Δ nem1Δ cells. A, cell extracts were prepared from late exponential phase cells (A600 nm ∼ 0.8) and used for Western blot analysis using anti-Pah1p and anti-Pgk1p (loading control) antibodies. The levels of Pah1p and Pgk1p were quantified with ImageQuant software. The relative amount of Pah1p/Pgk1p of the wild type enzyme was arbitrarily set at 100%. B, cell extracts were fractionated into the cytosol and membrane fractions by centrifugation. The membrane fraction was resuspended in the same volume as the cytosol fraction, and equal volumes of the fractions were subjected to Western blot analysis using anti-Pah1p, anti-Pgk1p (cytosol marker), and anti-phosphatidylserine synthase (endoplasmic reticulum marker) antibodies. As described previously (100), the Western blot analysis for the marker proteins indicated highly enriched cytosol and membrane fractions. The relative amounts of cytosolic and membrane-associated Pah1p were determined for the wild type and phosphorylation site mutant forms of the enzyme by ImageQuant analysis of the data. Each data point represents the average of four experiments ±S.D. (error bars). C, cultures were grown to the stationary phase (A600 nm ∼ 3) in the medium containing [2-14C]acetate (1 μCi/ml) to label lipids. The lipids were extracted and separated by one-dimensional TLC, and the phosphorimages were subjected to ImageQuant analysis. The percentages shown for TAG were normalized to the total 14C-labeled chloroform-soluble fraction. Each data point represents the average of three experiments ±S.D. (error bars).