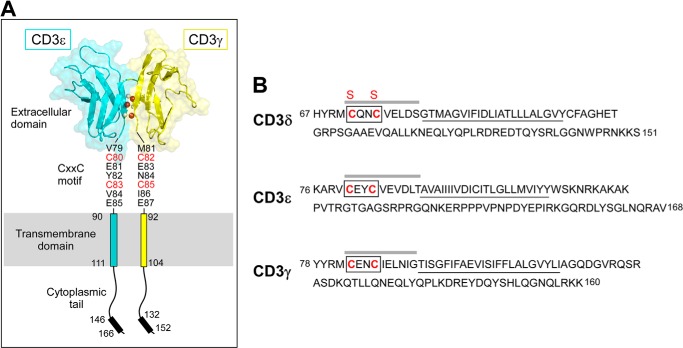
FIGURE 1.
Domain architecture of the CD3 subunits. A, the heterodimeric CD3ϵγ subunit complex is illustrated, where the CD3ϵ subunit is drawn in blue and the CD3γ subunit is in yellow. Select interdomain hydrogen bonds are shown on the G strands, in which the amide protons are drawn in gray and the carbonyl oxygen atoms are drawn in red. The cytoplasmic tails are illustrated vertically to depict receptor length, whereas physiologically, the tails may be associated with the inner leaflet of the plasma membrane. Each CD3 subunit contains an extracellular, transmembrane, and cytoplasmic domain. The CD3ϵγ extracellular domain structure was generated from the deposited PDB file 1XMW (18) using PyMOL (60). B, the partial mouse CD3 amino acid sequences are displayed and initiated at the membrane proximal region in each subunit. The TM domains are underlined. The boxed region drawn on each sequence highlights the CXXC motif. The sequence emphasized with a line above represents the peptides generated for measurement of the equilibrium reduction potentials. The CD3δ Cys to Ser mutations are denoted with red S labels above the native C labels in the sequence.

