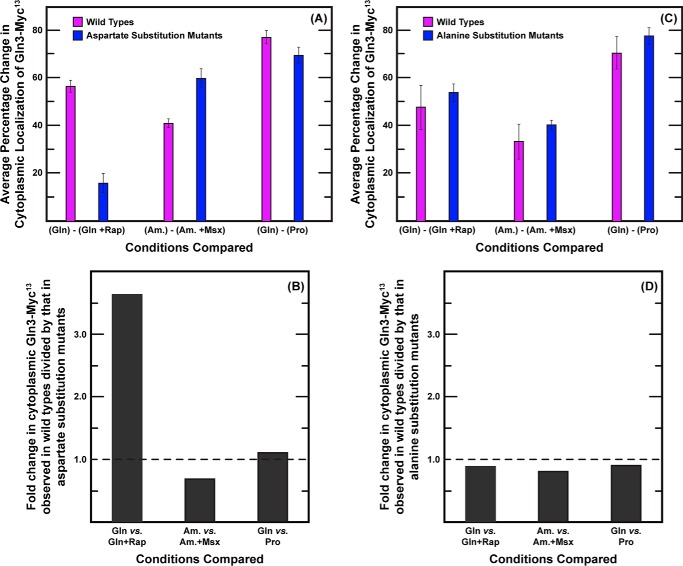
FIGURE 14.
Variation in the Gln3-Myc13 intracellular distribution profiles observed with nine aspartate (A) or nine alanine (C) substitution mutants exhibited the standard deviation as observed in nine wild type controls performed in parallel with them. The effects of aspartate substitutions were specific to rapamycin treatment (B), whereas alanine substitutions (D) yielded phenotypes identical to wild type. A value of 1.0 in B and D is indicative of no demonstrable effect of the mutations. The main text describes how these analyses were performed. The experiments from which these data were obtained were performed over a period of 3 years.

