
Fig. 3.
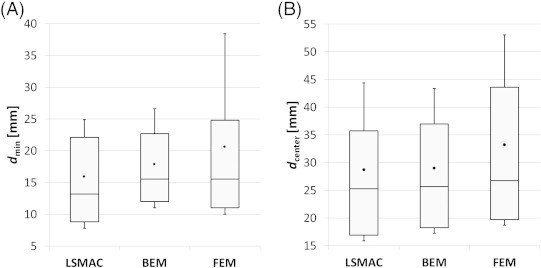
Distance from ESI-max to IZ. The black dots represent the mean distance, and the whiskers the standard deviation with respect to the mean. The horizontal line within the box is the median value, the top line of the box is the 3rd quartile while the bottom line is the 1st quartile. In panel A the minimum distance from ESI-max to IZ (dmin) is represented. In panel B distance from ESI-max to the centroid of IZ (dcenter) is represented.