
Fig. 1.
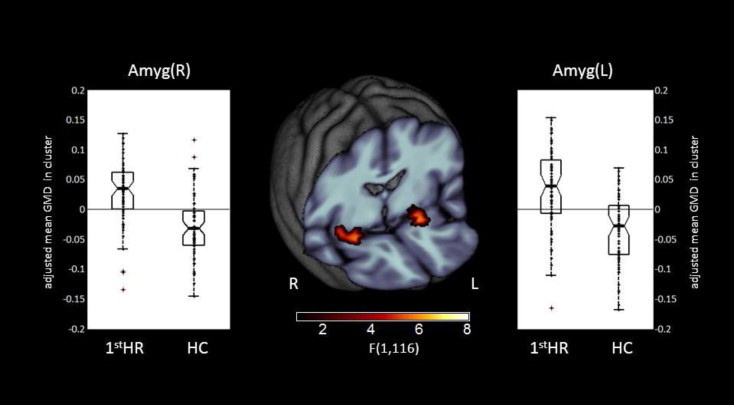
Whole-brain FWE correctable results. Middle panel: Clusters with a significant main effect of group. Left and right panels: Box plots for local gray matter volumes of H1stR (n = 63) and HC (n= 63) at peak voxel coordinates. The dots indicate the individual gray matter volumes. Abbreviation: CI — confidence interval; H1stR — healthy first-degree relatives of MDD patients; HC — healthy control subjects.