
Fig. 2.
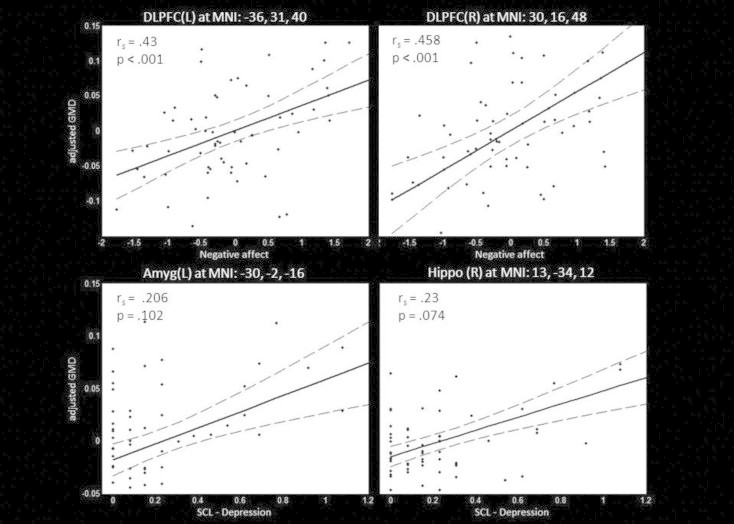
Correlation between SCL depression score and local gray matter volume in the left amygdala and right hippocampus as well as the negative affect composite score and bilateral DLPFC volume in H1stR (n= 63). Scatter plots between individual SCL — depression or negative affect score and gray matter volume at peak coordinate are shown. Additionally the post-hoc regression model (solid line) and its 95% confidence interval (dotted lines) are displayed. Abbreviations: rs – Spearman's rho; DLPFC — dorsolateral prefrontal cortex; Amyg — amygdala, Hippo — hippocampus.