
Fig. 3.
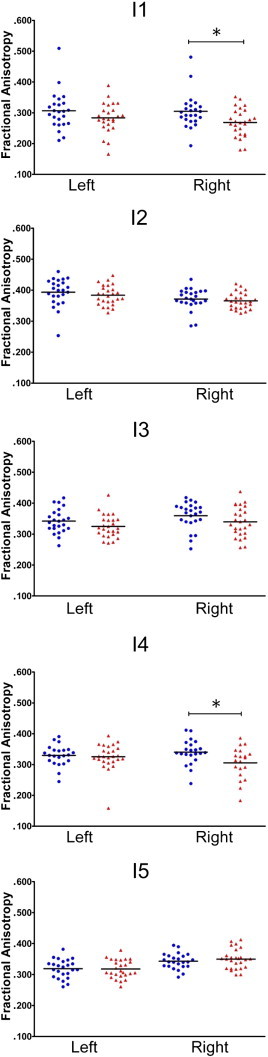
Between-group differences in FA in the five CB sub-connections (I1 through I5). Schizophrenia patients are shown as red triangles and control participants are shown as blue circles. The black bars represent the group means. *p < 0.05.
Official websites use .gov
A
.gov website belongs to an official
government organization in the United States.
Secure .gov websites use HTTPS
A lock (
) or https:// means you've safely
connected to the .gov website. Share sensitive
information only on official, secure websites.
Between-group differences in FA in the five CB sub-connections (I1 through I5). Schizophrenia patients are shown as red triangles and control participants are shown as blue circles. The black bars represent the group means. *p < 0.05.