
Fig. 4.
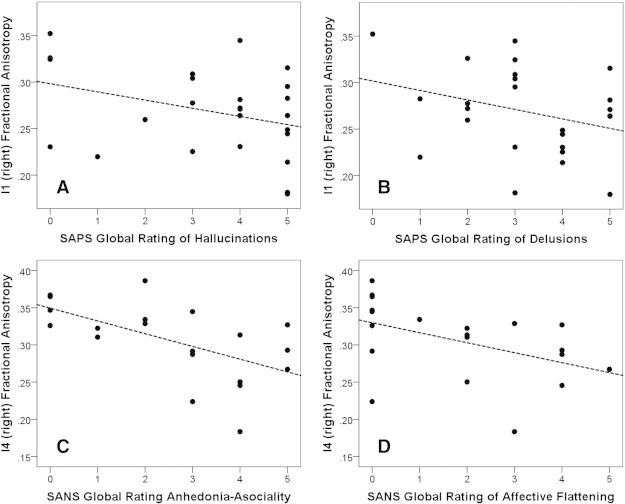
Scatterplots illustrating the significant correlations observed between FA and clinical symptoms in the 24 schizophrenia patients. Panel A shows the significant negative correlation between FA in the ‘right I1’ CB subregion and patients' score on the Hallucinations subscale of the SAPS. Panel B shows the significant negative correlation between FA in the ‘right I1’ CB subregion and patients' score on the Delusions subscale of the SAPS. Panel C shows the significant negative correlation between FA in the ‘right I4’ CB subregion and patients' score on the Anhedonia–Asociality subscale of the SANS. Panel D shows the significant negative correlation between FA in the ‘right I4’ CB subregion and patients' score on the Affective Flattening subscale of the SANS.