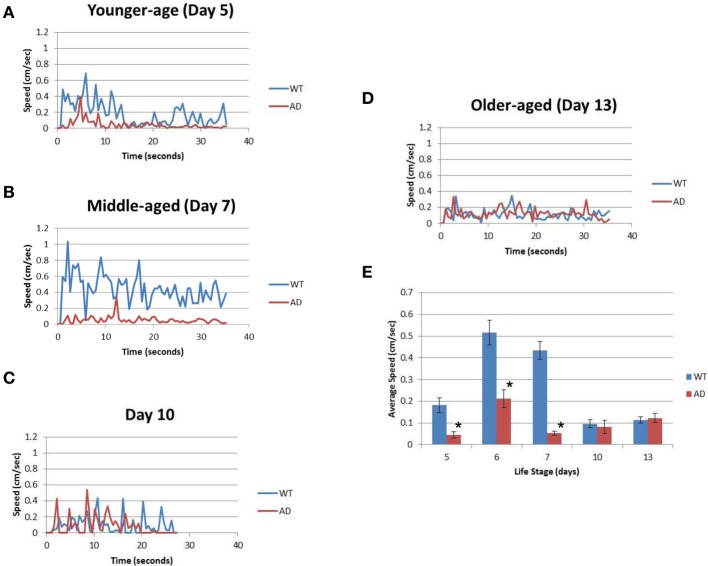
Figure 2.
The AD strain exhibits slower speeds than WT in the life cycle. (A) The graph represents the locomotion speed of adult worms measured at the age of day 5 (younger age). (B) The graph represents the speed for worms measured at the age of day 7 (middle age). (C) The graph represents the speed for middle-aged worms measured at the age of day 10. (D) The graph represents the speed for older adult worms measured at the age of day 13 (older age). (E) Comparison of the average speeds for WT (blue) and AD (red) worms at various ages over the course of their life span. Error bars indicate standard error of the mean. *p > 0.0001. WT worms (blue); and AD worms (red). See also Table 1.

