
Figure 1.
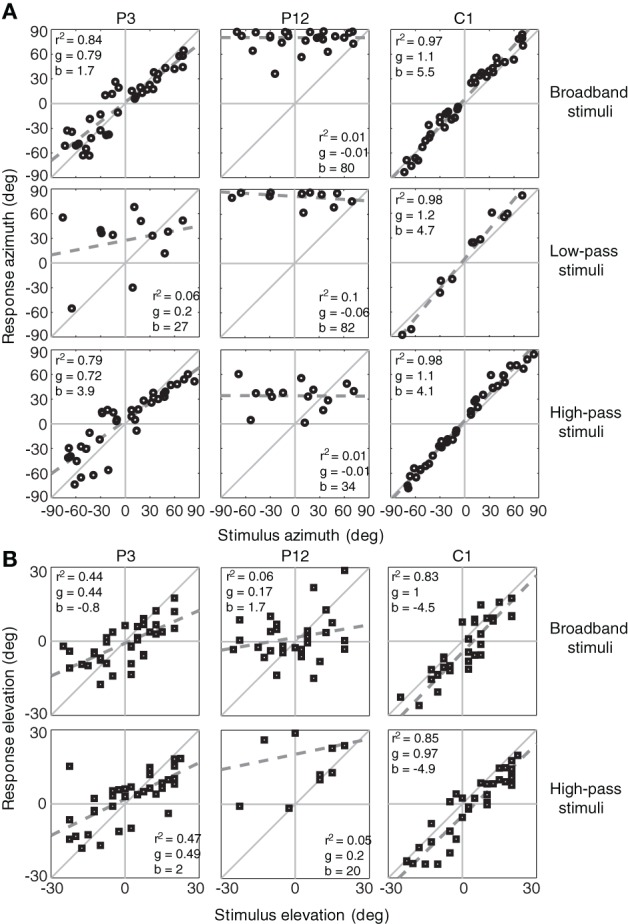
Sound-localization responses for SSD listener with a thresholds at 8 kHz < 40 dB HL (P3), a SSD listener with a thresholds at 8 kHz ≥ 40 dB HL (P12) and a control listener (C1). Responses are plotted for the BB, HP, and LP stimuli in azimuth (A) and elevation (B). The dashed gray line denotes the linear regression fit. Note the high degree of variation in monaural localization abilities of the listeners with SSD. Listener P3 had fairly good localization of BB and HP stimuli. r2, coefficient of determination, g, response gain, b, bias.