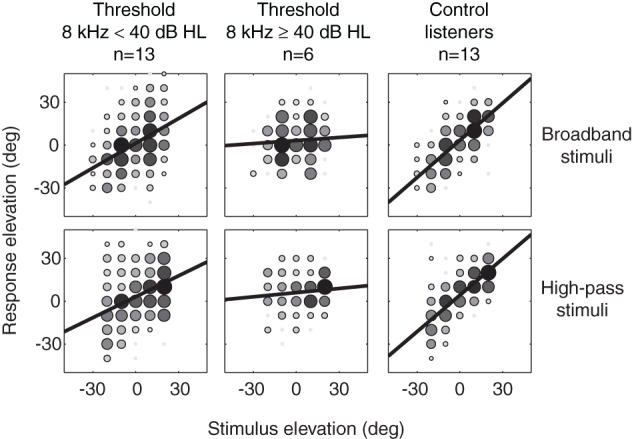
Figure 3.

Elevation stimulus-response relationships for BB and HP noise burst pooled for SSD listeners with 8 kHz thresholds below 40 dB HL (left hand column), SSD listeners with 8 kHz thresholds higher than 40 dB HL (middle column) and control listeners (n = 13, right hand column). Black bold lines denote best-fit regression lines over the pooled data. Grayscale and size of the data points indicates the number of responses on that location. Black indicates a larger number of responses than white.
