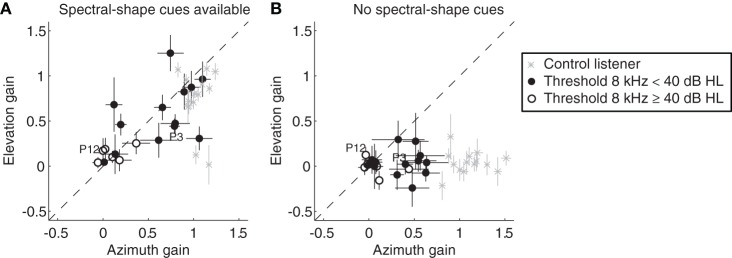
Figure 4.

Response elevation gain for BB stimuli plotted against the azimuth gain. Data from all control listeners (gray crosses), listeners with SSD with 8 kHz thresholds below 40 dB HL (filled circles) and SSD listeners with 8 kHz thresholds higher than 40 dB HL (open circles) are presented when spectral-shape cues were available (A), and when spectral-shape cues were reduced by molds (B). Error bars denote ± 1 SE of the azimuth and elevation regression coefficients. Data points from the two SSD listeners depicted in Figure 1 (P3 and P12), are indicated in the figure. Data are pooled across presentation levels. Note the two clear outliers in the control group. These two listeners demonstrated bilateral high-frequency hearing loss (8 kHz thresholds higher than 40 dB HL).
