
Figure 6.
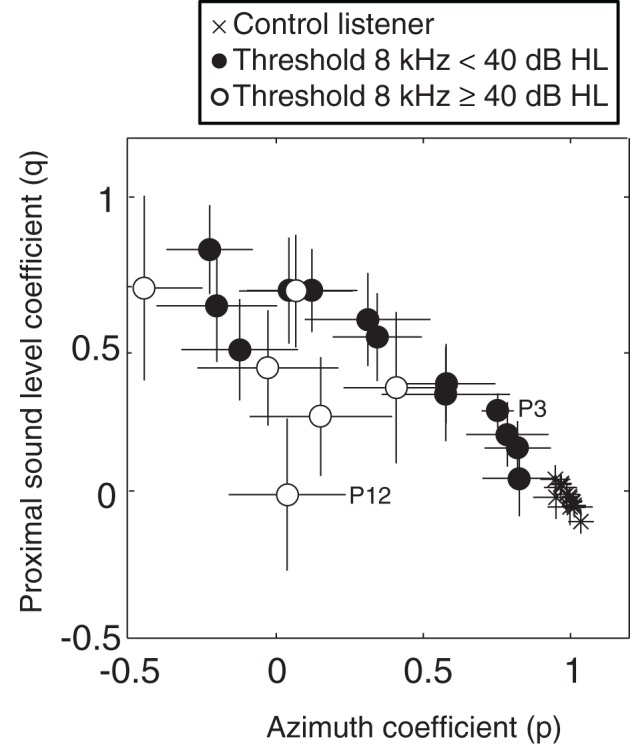
Multiple linear regression analysis of azimuth localization performance for BB stimuli of SSD listeners with 8 kHz thresholds below 40 dB HL (filled circles), SSD listeners with 8 kHz thresholds higher than 40 dB HL (open circles) and control listeners (crosses). The coefficients for proximal sound level (q in Equation 2) and azimuth (p in Equation 2) are plotted against one another for each listener. Error bars denote ± 1 SD of the azimuth and intensity regression coefficients, respectively. Data points from SSD listeners P3 and P12 are emphasized in the figure. For clarity, some data points are slightly shifted.