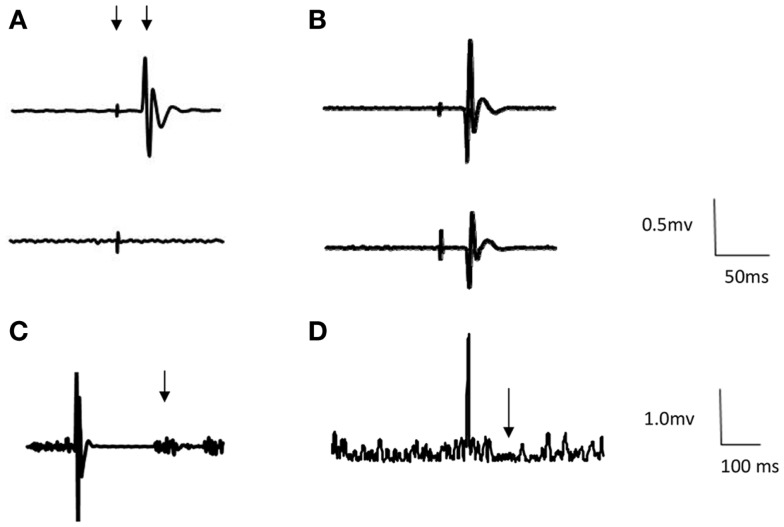
Figure 2.
Representative first dorsal interosseous (FDI) EMG traces from two participants. Arrows indicate stimulus artifact, MEP [example (A)], return of voluntary EMG [example (C)], and ipsilateral SP [example (D)]. (A) Example of appropriate response to TMS to the contralesional hemisphere. Top trace = unaffected FDI and bottom trace = affected FDI (Participant no. 1). (B) Example of bilateral response to TMS to contralesional hemisphere. Top trace = unaffected FDI and bottom trace = affected FDI (Participant no. 17). (C) Example of cortical silent period following ipsilesional stimulation (Participant no. 1). Traces are averages of 12 sweeps. (D). Example of ipsilateral SP following stimulation ipsilesional hemisphere (Participant no. 1). Traces are rectified averages of 12 sweeps.

