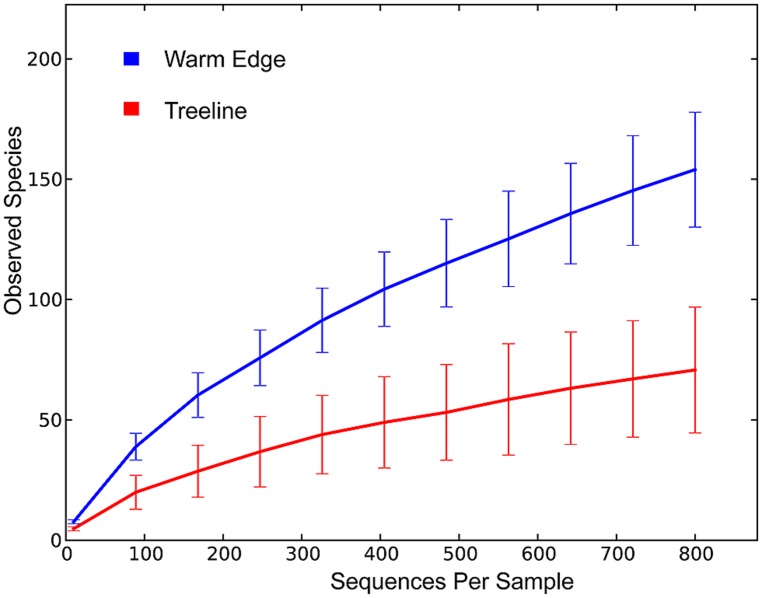
FIGURE 1.
Rarefaction curves for WE and treeline samples. There is no apparent asymptote in the rarefaction curves, suggesting that the sequencing depth does not encompass the full extent of phylotype richness in each of the communities. However, the rarefaction curves suggest that the lower number of phylotypes recovered from treeline samples was not due to insufficient sampling. The high and low of the error bars represent one SD away from the mean.

