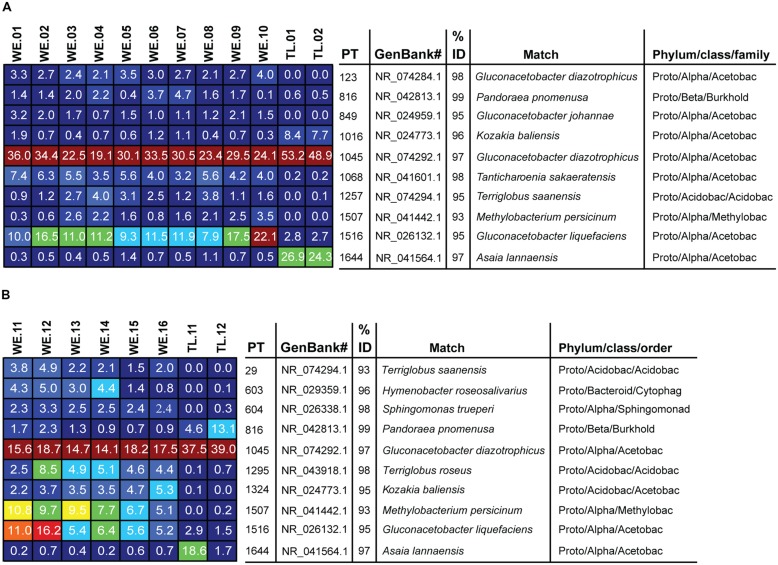
FIGURE 4.
Heatmap showing the 10 most dominant phylotypes and their average relative abundances as percentages of all sample 16S rRNA gene sequences recovered in our conifer needles samples. (A) P. flexilis, (B) P. engelmannii. Color tones range from cool (blue) to warm (red) to indicate the lowest to highest relative abundance values. Phylotypes were considered dominant if they were both highly abundant and occurred frequently in samples of a given conifer species. Abbreviations: PT = Phylotype, Acetobac = Acetobacteraceae, Acidobac = Acidobacteria/Acidobacteriaceae, Burkhold = Burkholderiaceae, Bacteriod = Bacteriodetes, Flexibacteraceae, Methylobac = Methylobacteriaceae, Cytophag = Cytophagacae, Sphingomonad = Sphingomonadaceae.

