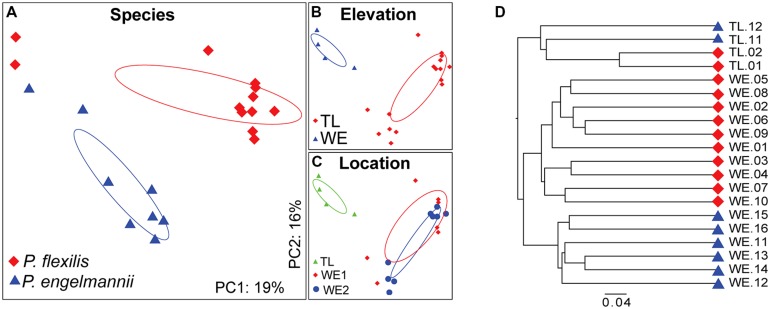
FIGURE 6.
PCoA and UniFrac analysis of the bacterial communities associated with conifer needles. (A–C) PCoA of the unweighted UniFrac distance matrix. Points that are closer together on the ordination have communities that are more similar. Each point corresponds to a sample, and shapes correspond to (A) host species, (B) elevation, and (C) location. (D) Hierarchical clustering of composite communities of the conifer species. Leaves are labeled by color according to host species: red, P. flexilis; blue, P. engelmannii.

