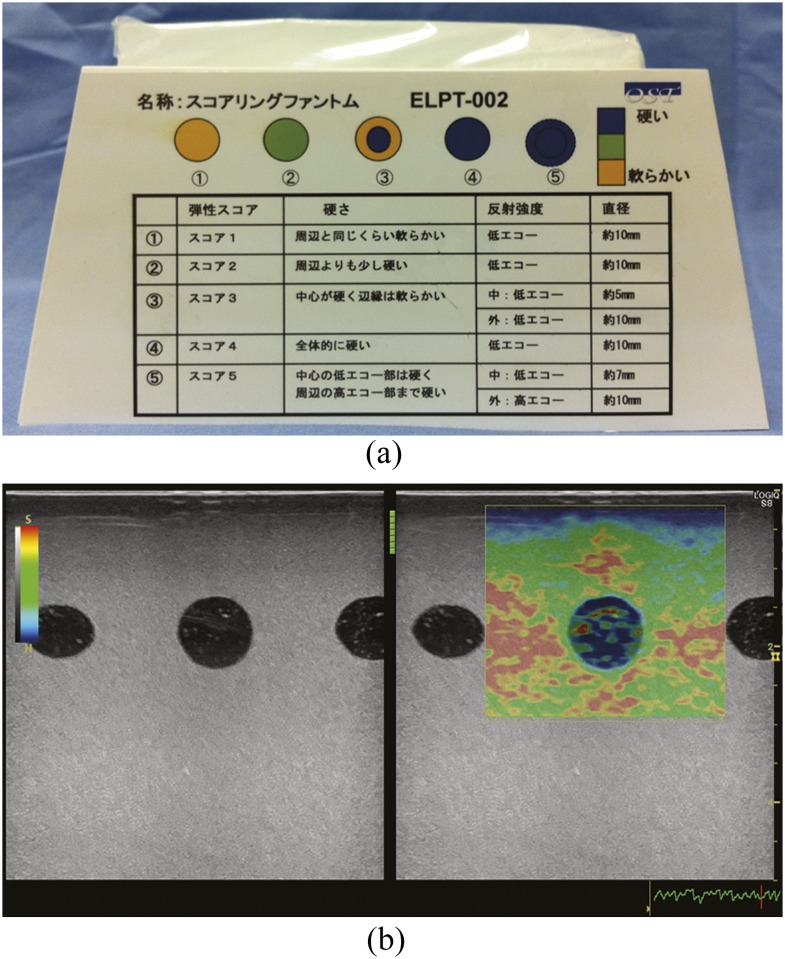
Figure 1.
The phantom and an elastographic image. (a) Elastography phantom. The phantom simulates the Tsukuba elasticity score. The five inclusions correspond to Scores 1–5, from left to right. (b) Elastographic image. Red represents soft and blue represents hard. A B-mode image is displayed to the left of the elastographic image. The quality bar is displayed between B-mode and elastographic images, and the quality graph is displayed on the lower right of an elastographic image. These indicators show the appropriateness of the compression force. A hard (blue) band approximately 4–5 mm thick is seen on the surface of the phantom.

