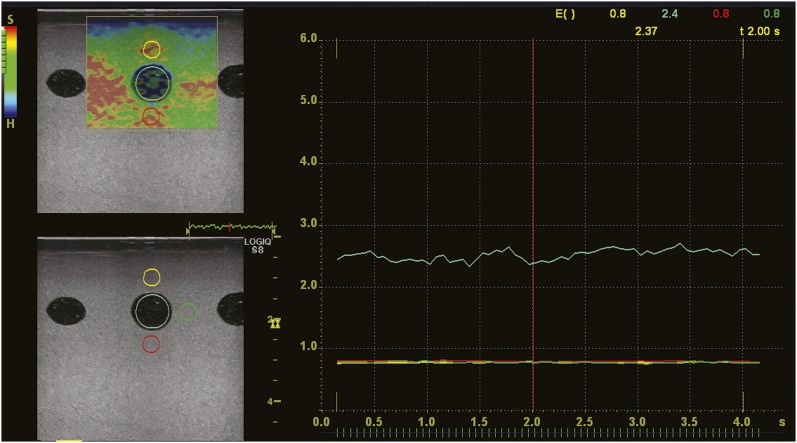
Figure 2.
Measurement of the elasticity index (EI). A region of interest (ROI) is placed on the inclusion (light blue circle) and the background above (yellow circle), below (red circle) and lateral to the inclusion (green circle). The EI of the background is measured as a reference for calculation of the elasticity ratio. The change in the EI with time is then displayed on a graph. The colour of the graph corresponds to that of the ROI. The EI at a point of time is displayed on the upper right of the graph.

