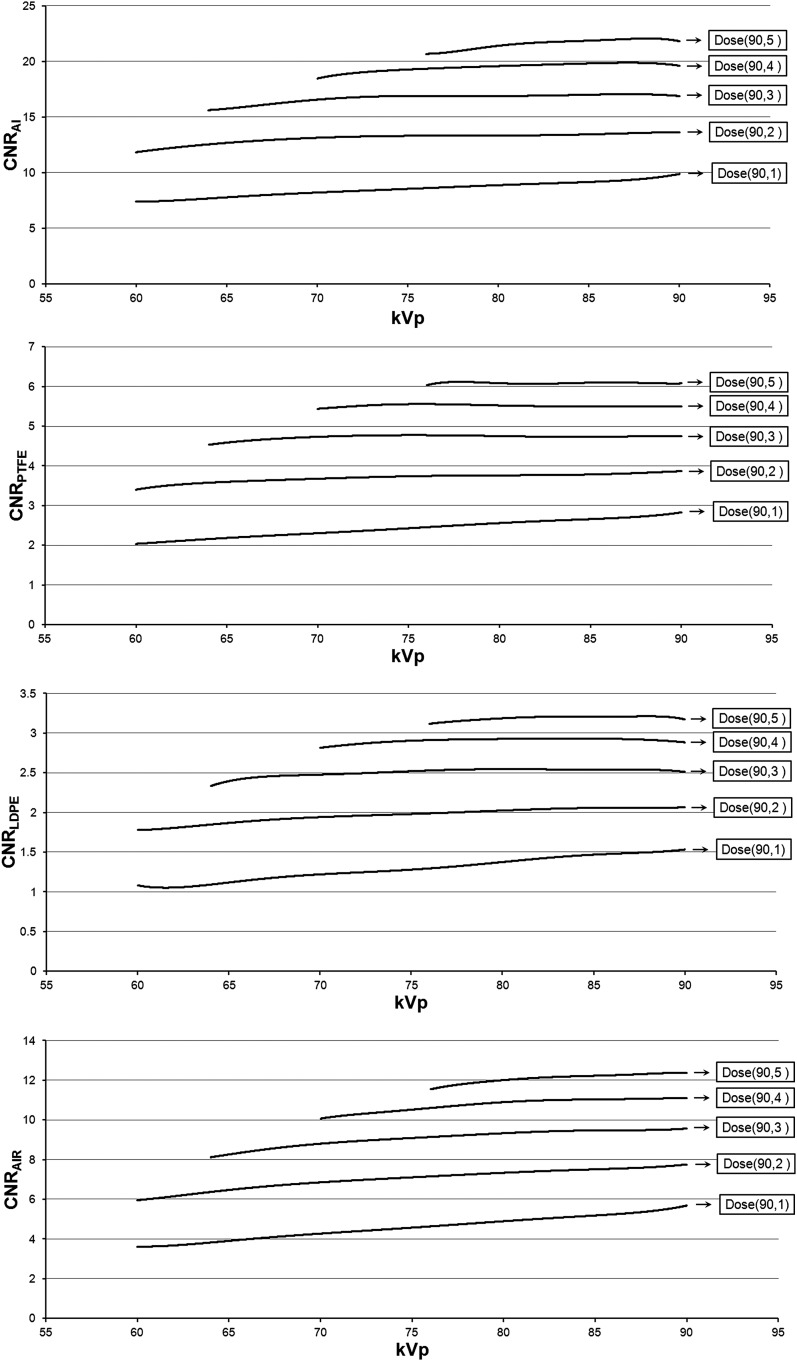
Figure 7.
Contrast-to-noise ratio (CNR) as a function of kVp at a fixed radiation dose. The CNR for a dose-normalized mA value was calculated for each kVp using the curves in Figure 5. Five dose levels are shown with absorbed doses of 3.3–16.4 mGy. Dose(x, y): dose level for x kV, y mA. Al, aluminium; LDPE, low-density polyethylene; PTFE, polytetrafluoroethylene.

