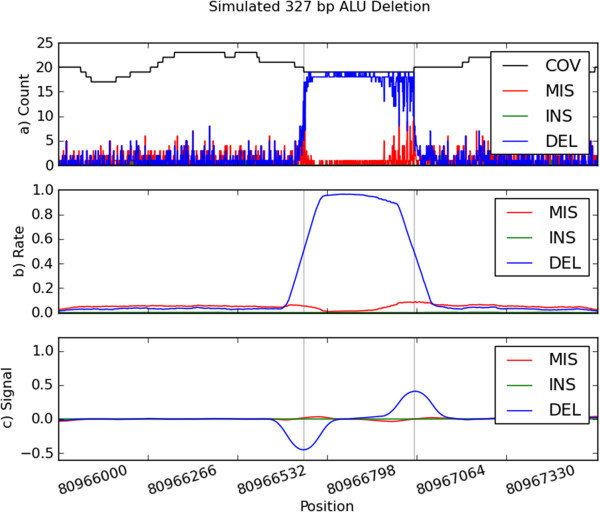
Figure 2.

Simulated ALU Deletion. Plot (a) depicts the raw channels for the 327 bp ALU Deletion. Raw channels include coverage (COV), mismatches (MIS), insertions (INS), and deletions (DEL). Plot (b) are the channels after smoothing, and plot (c) is the final signal after applying the slope kernel. The gray lines represent the start and end points of the deletion.
