Figure 6.

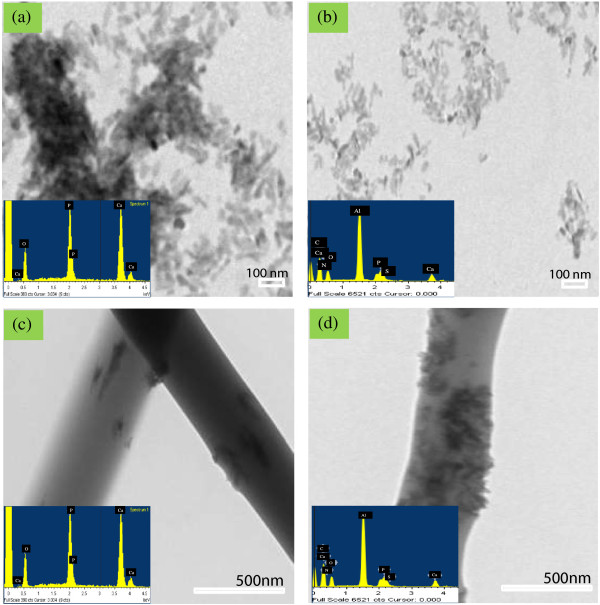
TEM images of (a) pristine nHA, (b) nHA-I, (c) PLGA/nHA, and (d) PLGA/nHA-I with their respective EDX graphs. Depicting their characteristics peaks and chemical compositions.

TEM images of (a) pristine nHA, (b) nHA-I, (c) PLGA/nHA, and (d) PLGA/nHA-I with their respective EDX graphs. Depicting their characteristics peaks and chemical compositions.