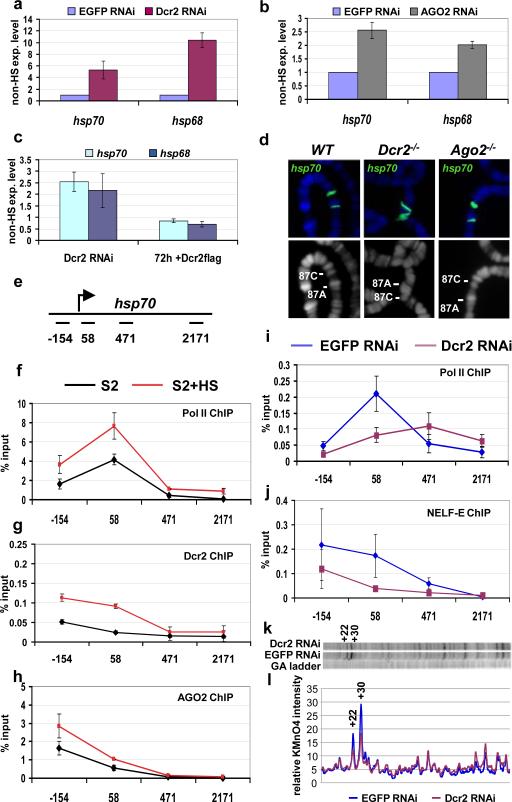
Figure 1. Pol II promoter-proximal pausing on hsp70 is reduced in Dcr2 RNAi cells.
a-c) Quantitative RT-PCR analysis of heat shock gene transcripts. RNA from S2 cells treated with EGFP dsRNA (control) or Dcr2 dsRNA (a), or AGO2 dsRNA (b) were analyzed with primers specific for the indicated heat shock genes. c) Induction of Dcr2-flag transgene is able to revert the phenotype induced by Dcr2-depletion. S2 cells stably transformed with a Dcr2-flag transgene were treated with EGFP dsRNA (control) or Dcr2 dsRNA. The Dcr2-flag expression is induced only in the Dcr2 RNAi sample by the addition of copper. The samples were analyzed before and after 72h induction of the transgene. The transcript levels are shown with respect to the EGFP control (experiment/control ratio). n=3, bars represent the mean±standard deviation. d) hsp70 DNA-FISH on polytene chromosomes from wild type (WT), homozygous Dcr2L811fsX or homozygous Ago2414 mutant larvae; lower pictures show DNA staining; upper pictures show the merge of DNA (blue) and FISH (green) signals. e) Schematic representation of the hsp70 transcription unit with the position of the PCR amplicons used in this study. The numbers indicate the middle of each amplicon with respect to the transcription start site. f-h) ChIP analysis of the hsp70 heat shock gene. Chromatin from S2 cells or S2 cells after exposure to heat shock (HS) was immunoprecipitated with anti-Pol II 4H8 (recognises the Ser5-phosphorylated CTD domain), anti-Dcr2 or anti-AGO2 antibodies. n=3, bars represent the mean± standard deviation. i-j) ChIP analysis of the hsp70 heat shock gene. Chromatin from S2 cells treated with EGFP dsRNA (control) or Dcr2 dsRNA was immunoprecipitated with anti-Pol II 4H8 or anti-NELF-E antibodies. The resulting DNA has been analyzed by quantitative PCR. Protein binding is expressed as a percentage of input subtracted by the background signal. n=3, bars represent the mean± standard deviation. Differences in Pol II ChIP values in 2f and 2i are due to different batches of antibody used in these assays. k) Permanganate mapping of open transcription bubbles on hsp70. Permanganate reacts with single-stranded thymine residues, like those in a open transcription bubble, revealing a transcriptionally engaged RNA polymerase. The autoradiograph includes a G/A ladder, used to determine the position of the bands, and the permanganate reactivity of thymine residues observed in S2 cells treated with EGFP dsRNA (control) or Dcr2 dsRNA. The hyper-reactive thymines +22 and +30 are labeled. Two independent biological samples have been analyzed. Shown is a representative picture l) Quantification of the autoradiograph.

