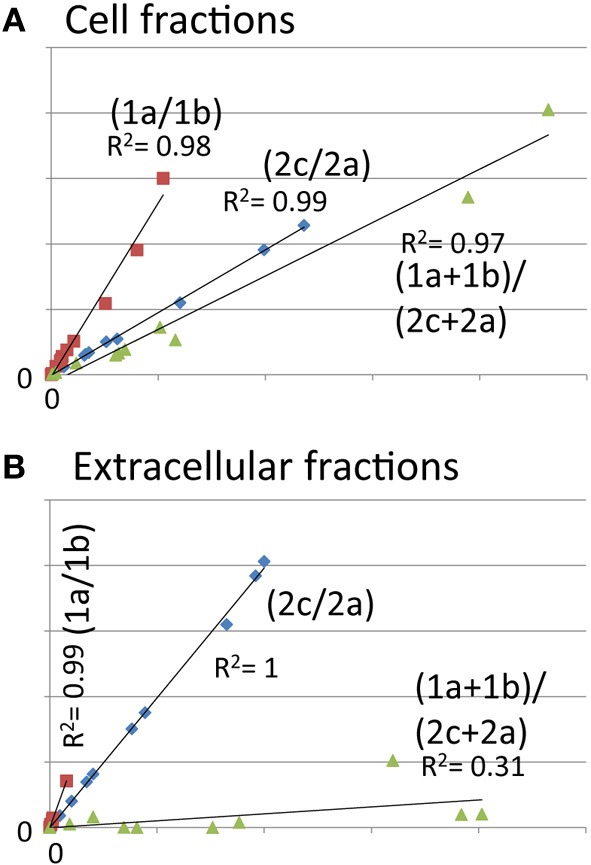
Figure 3.

Abundance of the N-terminal peptide of HrpA1 is very low in the extracellular fractions, indicating low abundance of full length HrpA1. Scatter plots of analyte peak counts of HrpA1 from twelve cell (A) and extracellular (B) samples (as in Figure 2). (A) Correlation of peak counts for transitions 1a and 1b from peptide ISATATNAK (red squares), 2c and 2a for peptide LTNLGNSAVGGVGGALQGVNTVASNATLQK (blue diamonds), and the sums of transitions from both peptides (green triangles). R squared values for trend lines are as indicated.
