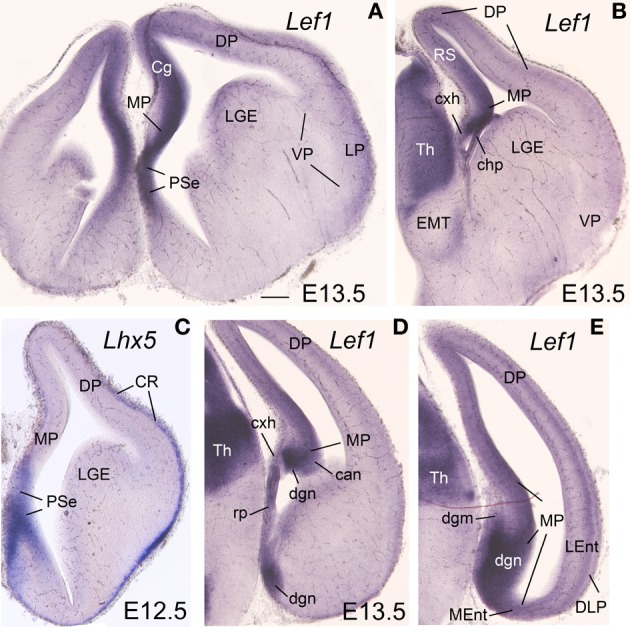
Figure 1.

Expression of Lef1 in mouse embryonic telencephalon at E13.5. Digital images of coronal sections of mouse embryonic telencephalon (E13.5), from rostral (A) to caudal (E) levels, hybridized for Lef1. Note the strong expression in the ventricular zone of the medial pallium and pallial septum. For abbreviations see list. Scale bar: (A) = 200 μm (applies to all).
