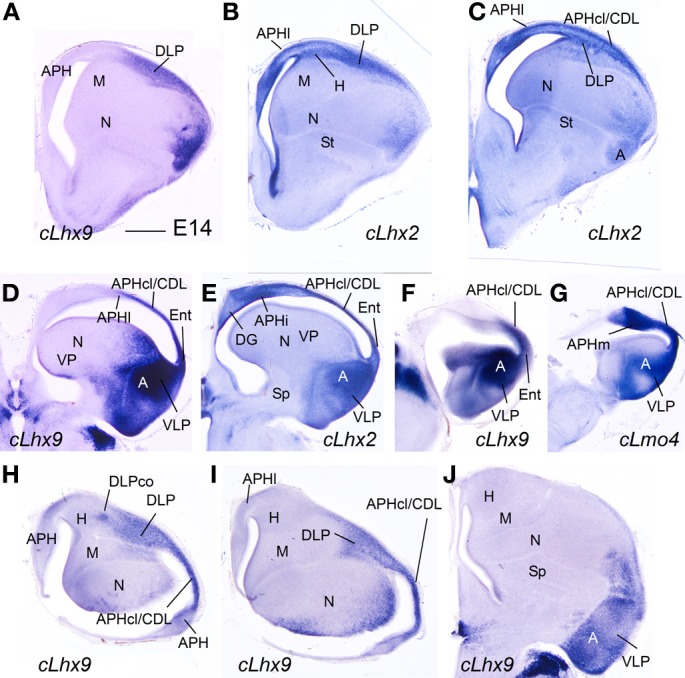
Figure 10.

Expression of several genes in the chicken embryonic telencephalon at intermediate stages. (A–G) Digital images of coronal sections of chicken embryonic telencephalon (E14), at intermediate (A–C) or caudal (D–G) levels, hybridized for cLhx2, cLhx9, or cLmo4. (H–J) Digital images of horizontal sections of chicken embryonic telencephalon (E14), from top (H) to bottom (J), hybridized for cLhx9. Note the distinct genetic profile of DLP and VLP. For abbreviations see list. Scale bar: (A) = 1 mm (applies to all).
