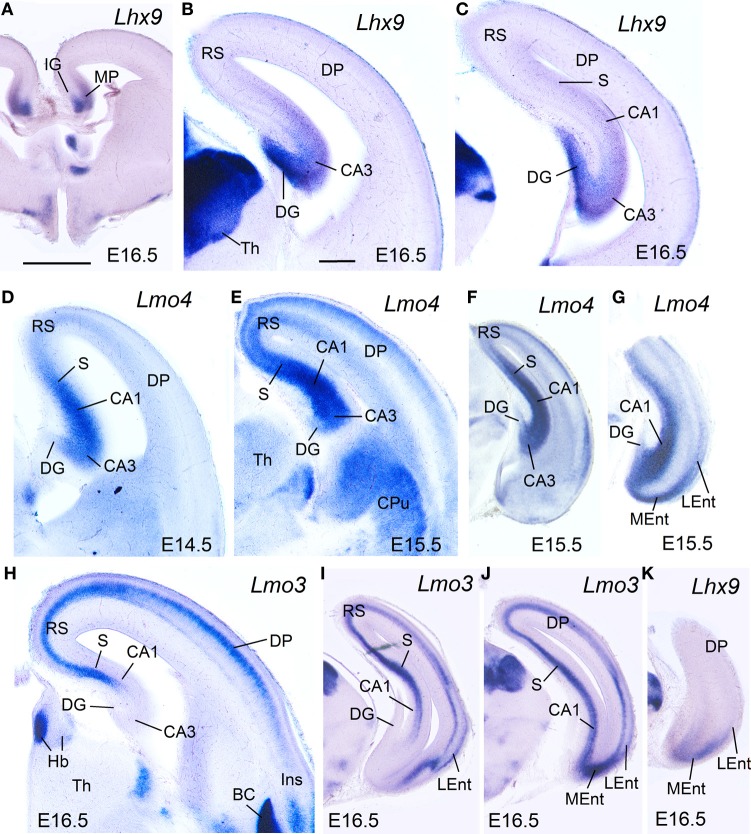
Figure 4.
Expression of Lhx9, Lmo3, and Lmo4 in mouse embryonic telencephalon at intermediate stages. Digital images of coronal sections of mouse embryonic telencephalon (E15.5 or E16.5), at intermediate (A–E,H) or caudal (F,G,I–K) levels, hybridized for Lhx9, Lmo3, or Lmo4. For abbreviations see list. Scale bar: (A) = 1 mm (applies to A,F,G,I–K); (B) = 300 μm (applies to B–E,H).

