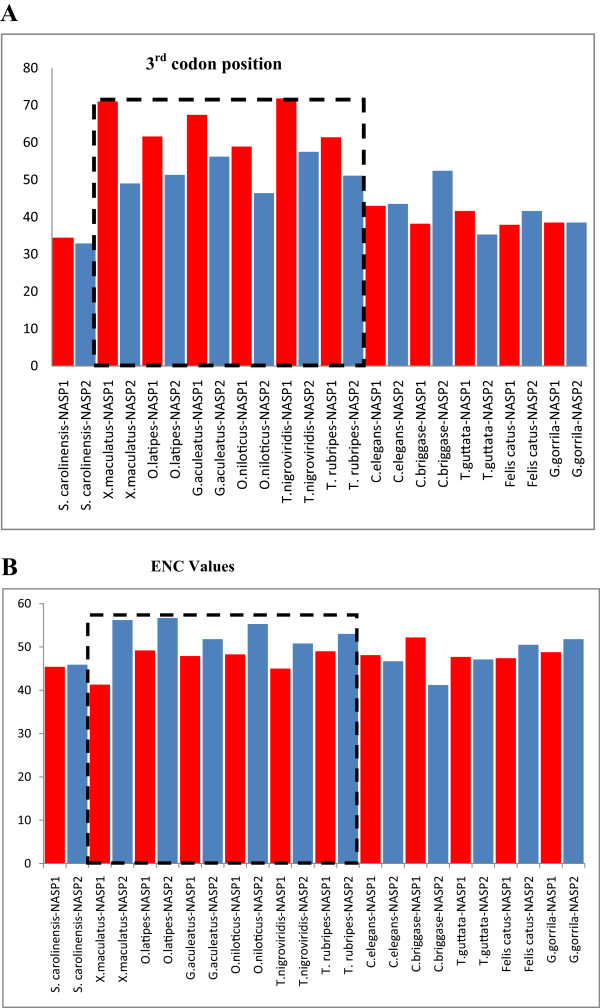
Figure 4.

Comparison of %GC3 and ENC values among NASP paralogs. A- GC content at the third codon position of NASP paralogs among different lineages. The box signifies estimated values for %GC3 in fish lineages. B- The extent of codon usage bias referred to as ENC values among two NASP paralogs. The box indicates ENC for fish lineages.
