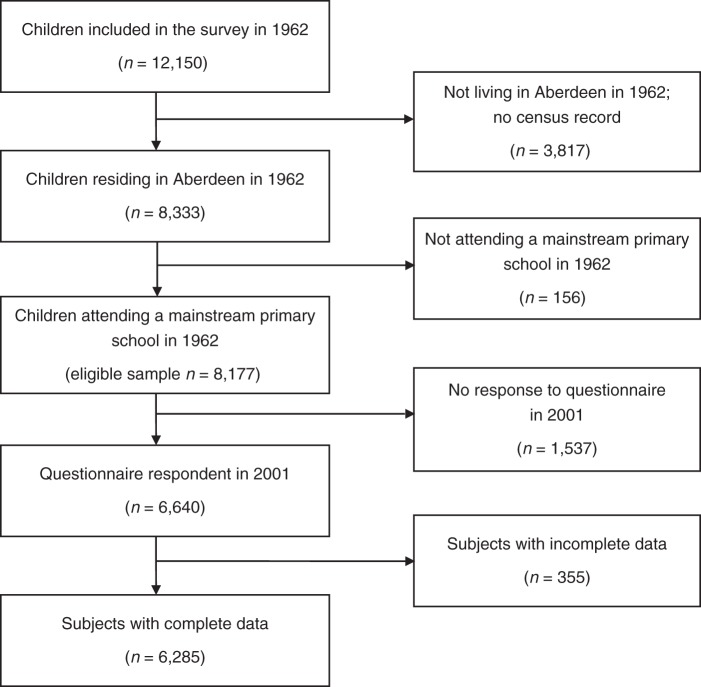
Figure 1.
Flow chart of participants in the Aberdeen Children of the 1950s Study who were included in the analysis. The eligible sample is those who participated in the 1962 survey and were attending a mainstream primary school and residing in Aberdeen, Scotland. The proportion of eligible subjects with complete data is 76.9%.

