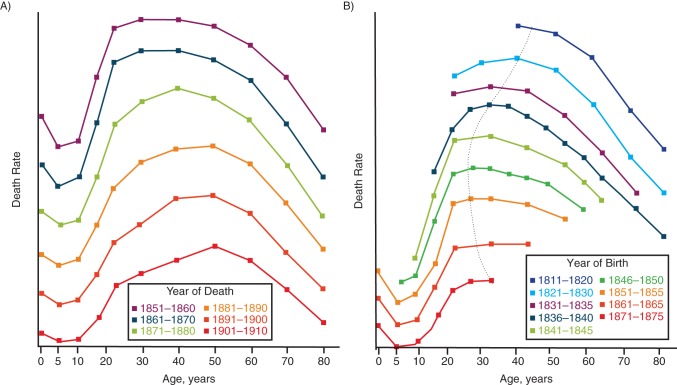
Figure 1.
Age-specific rates of death from phthisis (no unit given), London, United Kingdom. A) Rates for 6 decades of years of death in men, England, 1851–1910. B) Rates for 8 generations, by year of birth; the dotted line connects the maximum death rates across generations. Adapted from Brownlee (2).

