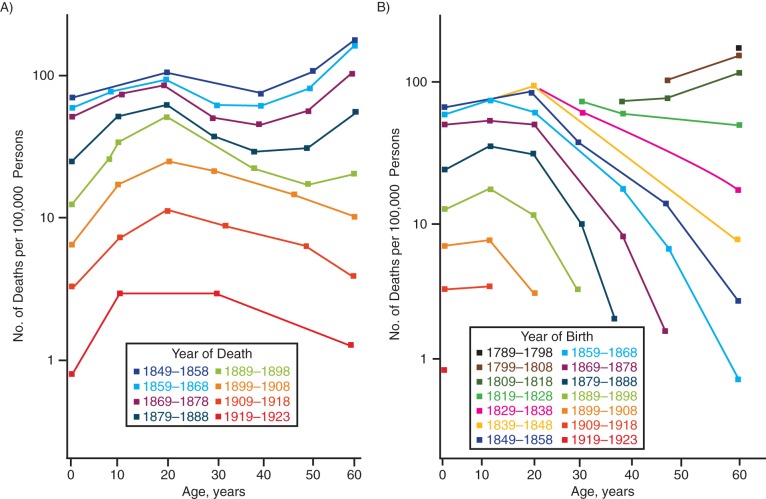
Figure 4.
Age-specific death rates (per 100,000 persons) from typhoid fever in Massachusetts, 1849–1923. A) Rates for 8 decades of years of death. B) Rates for 13 cohorts by decades of years of death between 1789 and 1923. Adapted from Bigelow and Doering (13).

