
Figure 21.
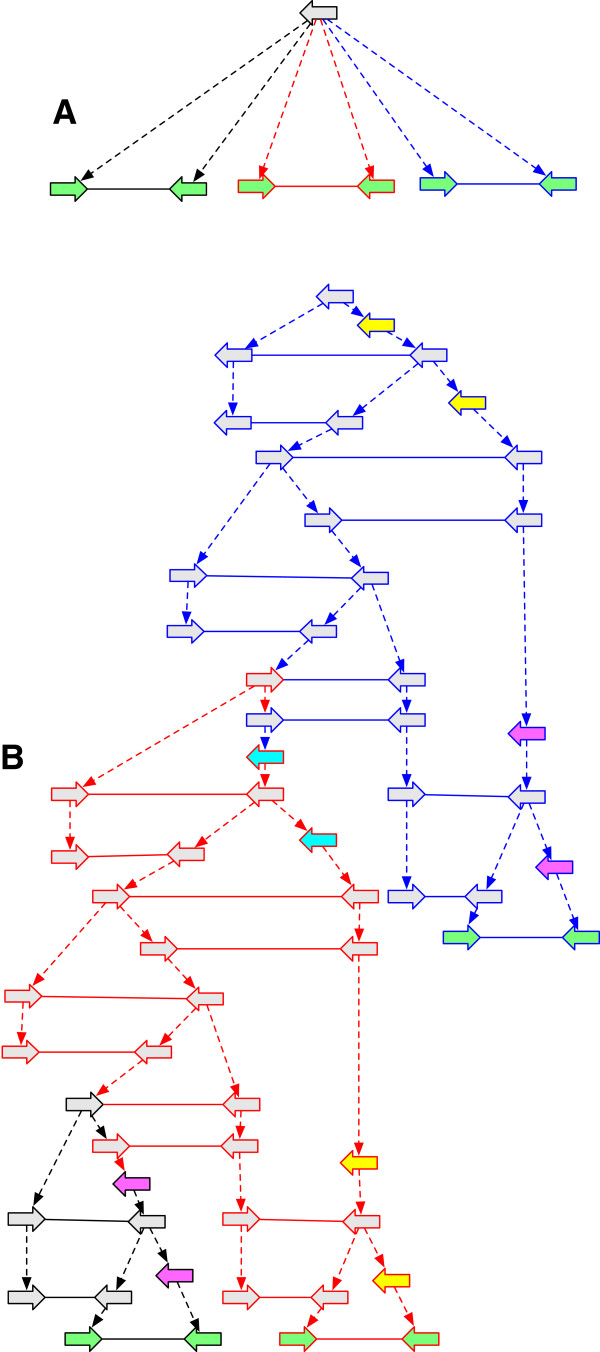
Demonstrating the tightness of Theorem 3. (A) The combination of the history graphs in Figures 19(A) and 20(B), constructed by merging their root vertices. (B) A G-bounded AVG extension of the graph in (B) with 22 extra adjacencies and 54 extra vertices, the maximum possible. The colouring of the elements is used to demonstrate the bound is tight for any combination of m and n, and follows that used in Figure 19.