
Figure 9.
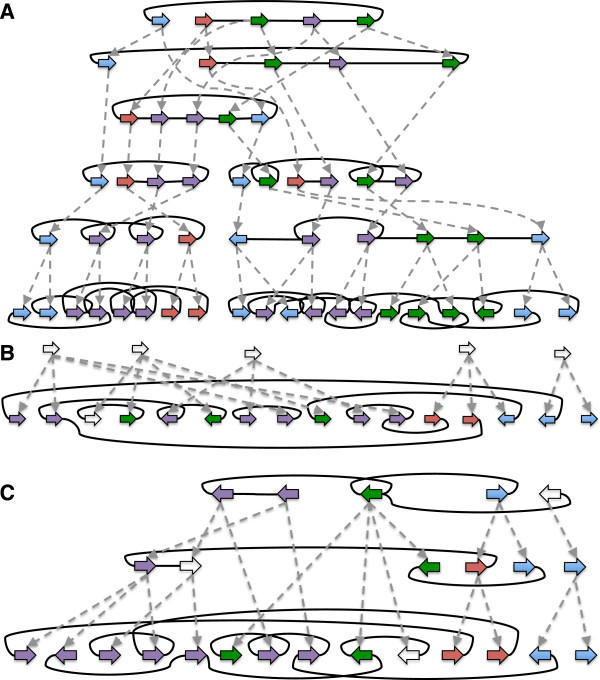
History graph examples generated by simulation. (A) H, (B)G, (C) An example of Hrmin and Hsmin. Example corresponds to experiment 1 in Tables 1 and 2. The G-bounded extension sequence from G to this AVG involved the creation of just 7 adjacencies, 5 vertices and 7 labels. Graph layouts were computationally derived.