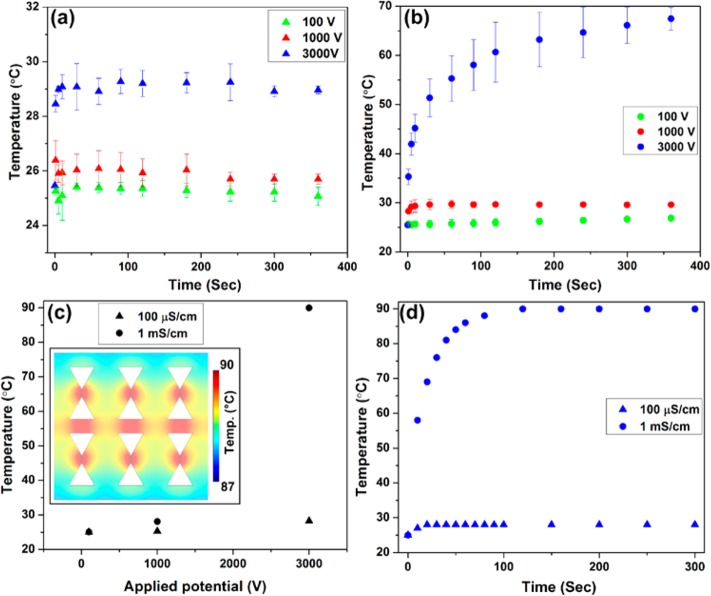
Figure 4.
(a,b) Experimentally and (c) numerically obtained temperature resulted from Joule heating inside of the iDEP channel, tested with various conductivities and applied potentials. (a,b) Experimentally measured temporal temperature variations using a phosphate buffer with conductivity of (a) 100 μS/cm (∼0.6 mM) and (b) 1 mS/cm (∼5 mM). Three different potentials were tested for each conductivity of 100 μS/cm (triangles) and 1 mS/cm (dots): 100 V (green), 1000 V (red), and 3000 V (blue) for a 1 cm long channel. (c) Numerical simulation results showing the steady state temperatures as a function of applied potential for the buffer conductivity of 100 μS/cm (tringles) and 1 mS/cm (dots). Inset shows the spatial temperature variations, revealing that the temperature variation is ∼1.5 °C within the channel. (d) Temporal temperature variations obtained numerically for 100 μS/cm (triangles) and 1 mS/cm (dots) when 3000 V is applied.

