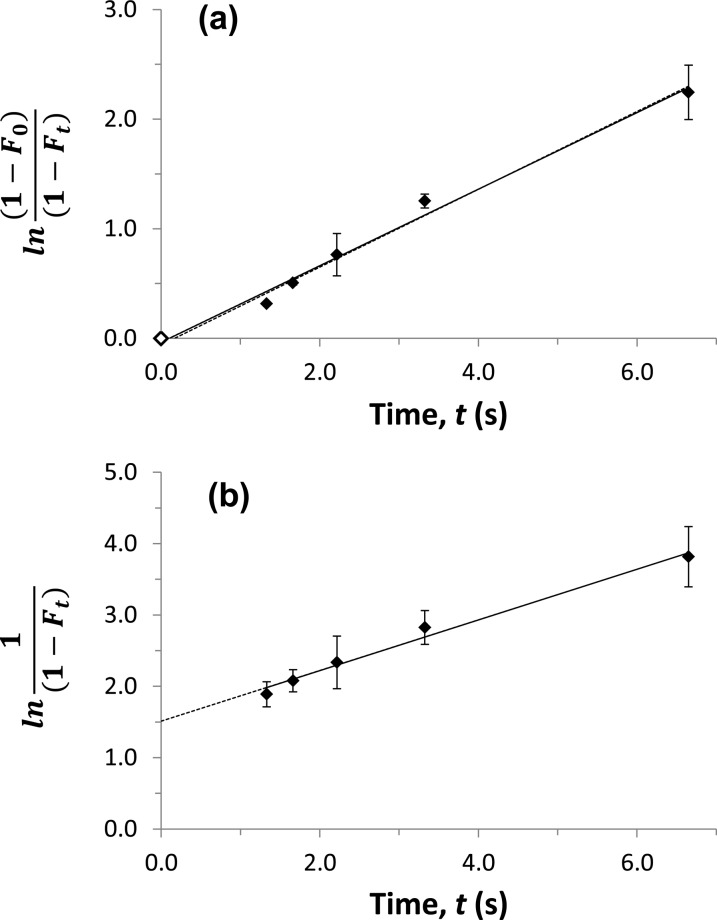
Figure 3.
Measurement of the dissociation rate constant for verapamil and soluble HSA at pH 7.4 and 37 °C, as determined by measuring apparent free drug fractions using ultrafast affinity extraction. The samples contained 10 μM verapamil and 20 μM soluble HSA. The results were analyzed by using (a) eq 4 or (b) eq 5. The solid line in (a) shows the result that was obtained when a point at the origin was included (◊), and the dashed line shows the result obtained when this point was not included; the equations for these two best-fit lines were y = 0.35 (±0.02) x – 0.04 (±0.06) and y = 0.36 (±0.02) x – 0.06 (±0.09), respectively. In (b), the best-fit equation was y = 0.36 (±0.02) x + 1.51 (±0.09). The correlation coefficients for these plots ranged from 0.993 to 0.995 (n = 5−6). The error bars represent a range of ±1 SD and, in some cases, were comparable in size to the data symbols.

