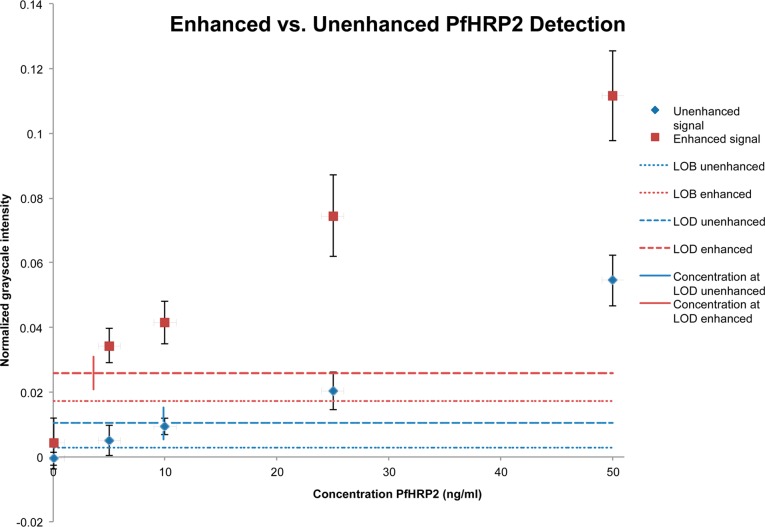
Figure 5.
Unenhanced (blue) and enhanced (red) assay results for varying concentrations of PfHRP2 antigen. Four replicates of each concentration were performed, and assay devices were imaged at 15 min to quantify unenhanced signal and then again at 60 min to quantify the enhanced signal. The average signal for each concentration of antigen is plotted here (n = 4, error bars = s.d.* n = 2 for the enhanced 10 ng/mL data due to two tests failing to enhance fully.) Dashed lines indicate the limit of detection signal intensity for both enhanced (red) and unenhanced (blue) assays, and the short vertical lines intersecting those dashed lines indicate the PfHRP2 concentration corresponding to that signal (at 3.6 and 9.9 ng/mL, respectively). The dotted lines indicate the limit of blank for both enhanced (red) and unenhanced (blue) assays.

