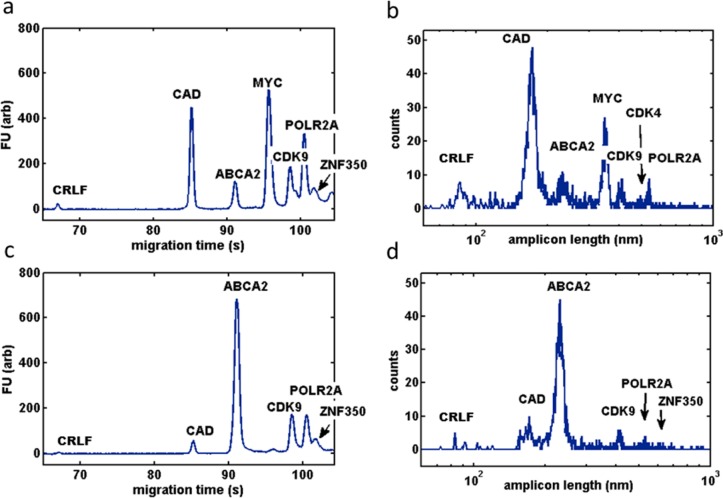
Figure 1.
(a) Bioanalyzer chromatogram of human reference total RNA 10-plex amplicons (1 μL, conc. 800 pg/μL) compared to (b) size distribution of amplicons measured with AFM (est. ∼1 μL, conc. 10 pg/μL; 2500 molecules). Note that the AFM-determined amplicon sizes are plotted on a logarithmic scale for comparison purposes. Human brain total RNA 10-plex measured by (c) a bioanalyzer (800 pg/μL) and (d) AFM (10 pg/μL; 1500 molecules).

