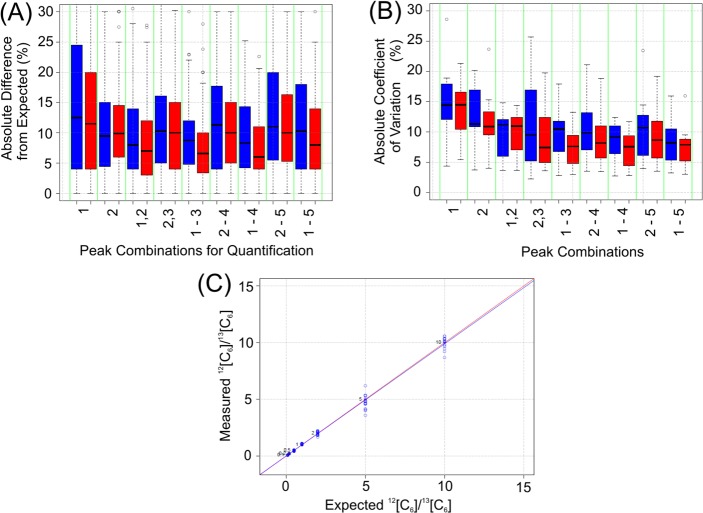
Figure 4.
Selection of best MS signals for the quantification. All the MS signals were obtained from the MALDI-MS spectra of three pairs of fetuin N-glycans (m/z: 2405.9 vs 2411.9, 3075.2 vs 3081.2, and 3379.3 vs 3385.3, Figure 3B) with a series of premixed ratios (10:1, 5:1, 2:1, 1:1, 1:2, 1:5, and 1:10). The % absolute difference from expected ratios (A) and the absolute coefficient of variation (CV) among all measurements (B) were shown as boxplot diagrams, employing the different combinations of various isotopic peaks (peak area, blue; and peak height, red). The height combination of first three peaks (1–3) was chosen as the best MS signals for the quantification calculation. This combination yielded the standard curve plot (C), including all three pairs of sialylated glycans (blue trend line), showing a nearly exact fit to the theoretical trend line (red) in a range from (10:1 to 1:10) when analyzed by MALDI-MS.

