Figure 6.
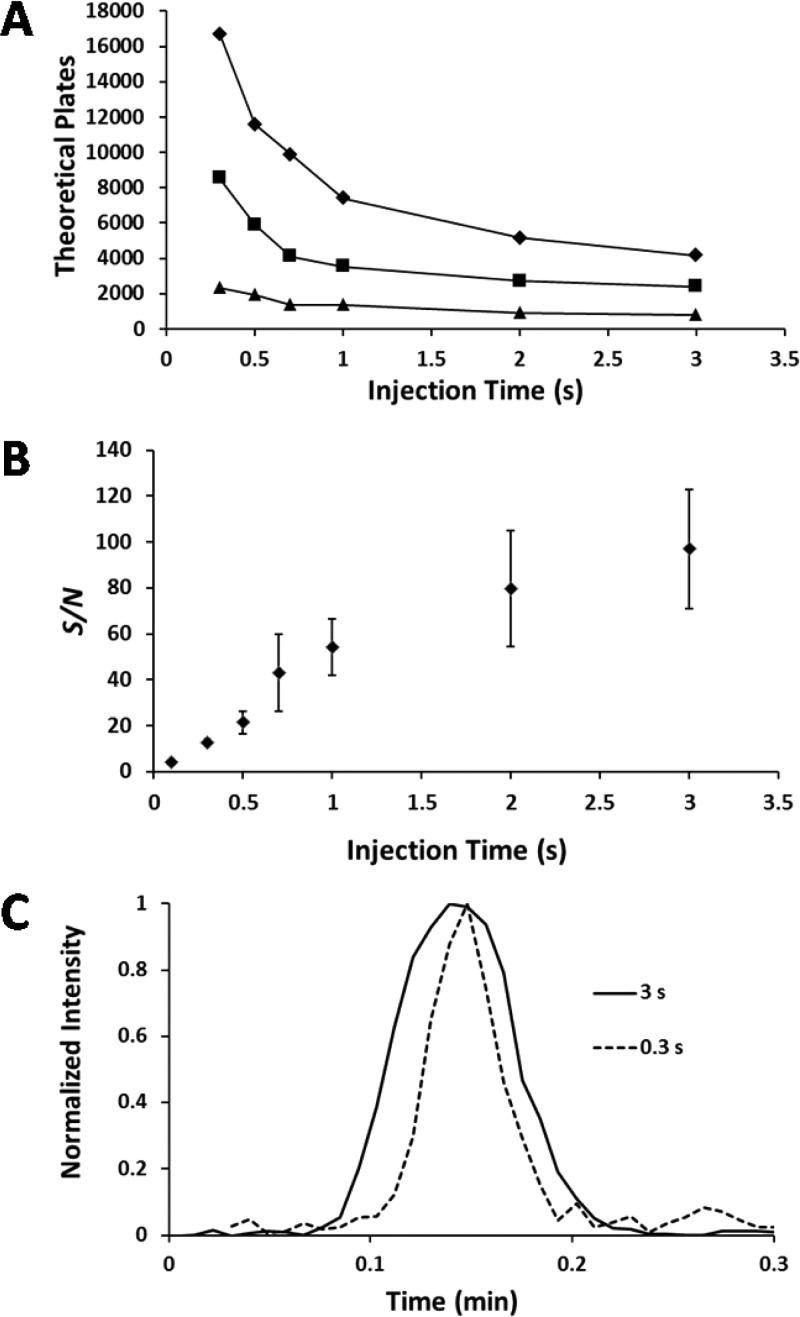
Separation performance as a function of eluting pressure and injection time. (A) Theoretical plates vs injection time for leucine enkephalin. Separation potential was 13 kV for each separation. The eluting and injection pressures were both 1 (◆), 2 (■), and 4 psi (▲). (B) S/N vs injection time for kemptide. The eluting and injection pressures were both 2 psi. Error bars are standard deviation for three replicate separations. (C) Kemptide peak resulting from 0.3 and 3 s injections (2 psi eluting and injection pressures).

