
Figure 3.
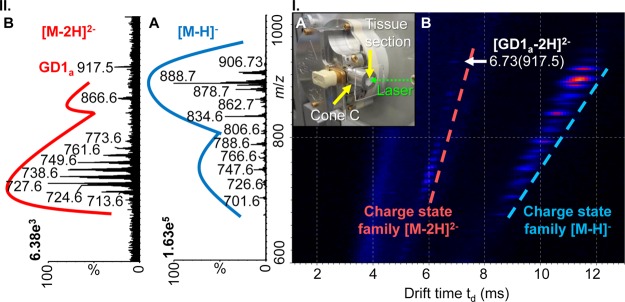
Transmission geometry LSIV-IMS-MS directly from mouse brain tissue in negative ion mode. (I.A) Photo of entrance region of the LSIV source with a mouse brain tissue section on a glass plate adhered to Cone C. (I.B) 2-D plot of drift time versus m/z with lines indicating separated charge state families. (II) Extracted mass spectra: (II.A) [M – H]− and (II.B) [M – 2H]2– charge state families. Data was obtained using the Z-Spray ion source of the Waters SYNAPT G2 with matrix 3-NBN at a source temperature of 80 °C. Details of tentative lipid assignments are provided in Figure S12, Supporting Information. Mass spectra and drift times of GD1 standards are provided in Figures S13 and S14, Supporting Information.