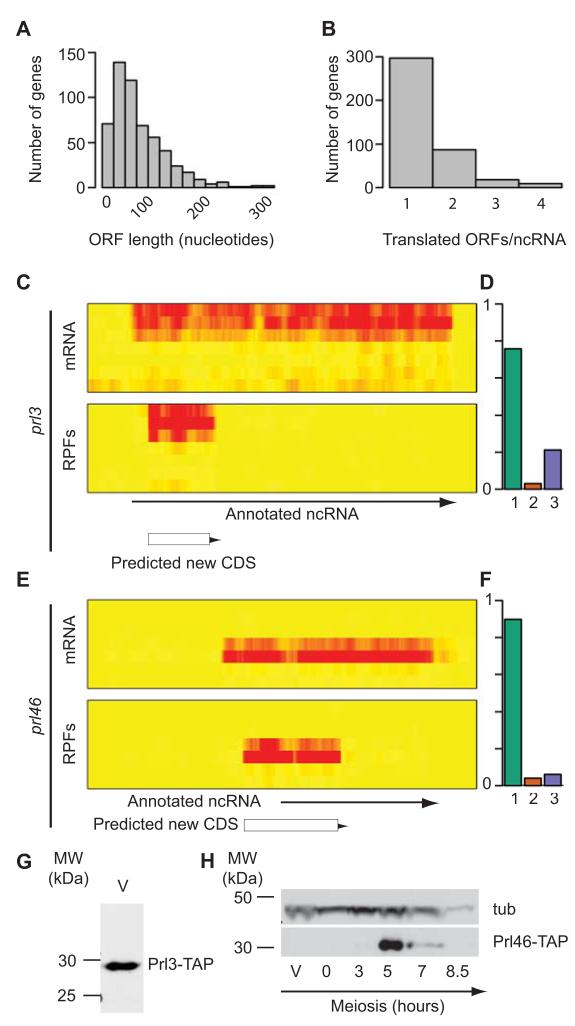
Figure 4. Identification of translated regions in annotated ncRNAs.
(A) Histogram showing the length distribution of all translated uORFs (measured in nucleotides). (B) Number of translated ORFs per ncRNA. (C) Expression and translation of the prl3 gene. The heat maps show mRNA (top) and RPF levels (bottom) across the meiotic time course, starting with vegetative cells at the top and progressing downwards. The brightness of the red color is proportional to the number of reads. The arrow shows the position of the annotated ncRNA, and the box that of the translated ORF. (D) Triplet periodicity for the translated ORF in prl3. The graph shows the fraction of codons in which a majority of the reads map to nucleotides 1, 2 or 3 for the ORF. (E) Expression and translation of the prl46 gene. Labelling as in C. (F) Triplet periodicity for the translated ORF in prl46. Labelling as in D. (G) Expression of the Prl3 protein. The translated ORF in prl3 was tagged with a TAP epitope and detected by Western blot in vegetative cells (V). (H) Expression of the Prl46 protein. The translated ORF in prl46 was tagged with TAP and detected by Western blot. A single band of the expected molecular weight was observed at 5 hours into meiosis, coinciding with the peak of translation. The blot was also probed with antibodies against tubulin (tub). Full blots are presented in Supplementary Fig. 8.

