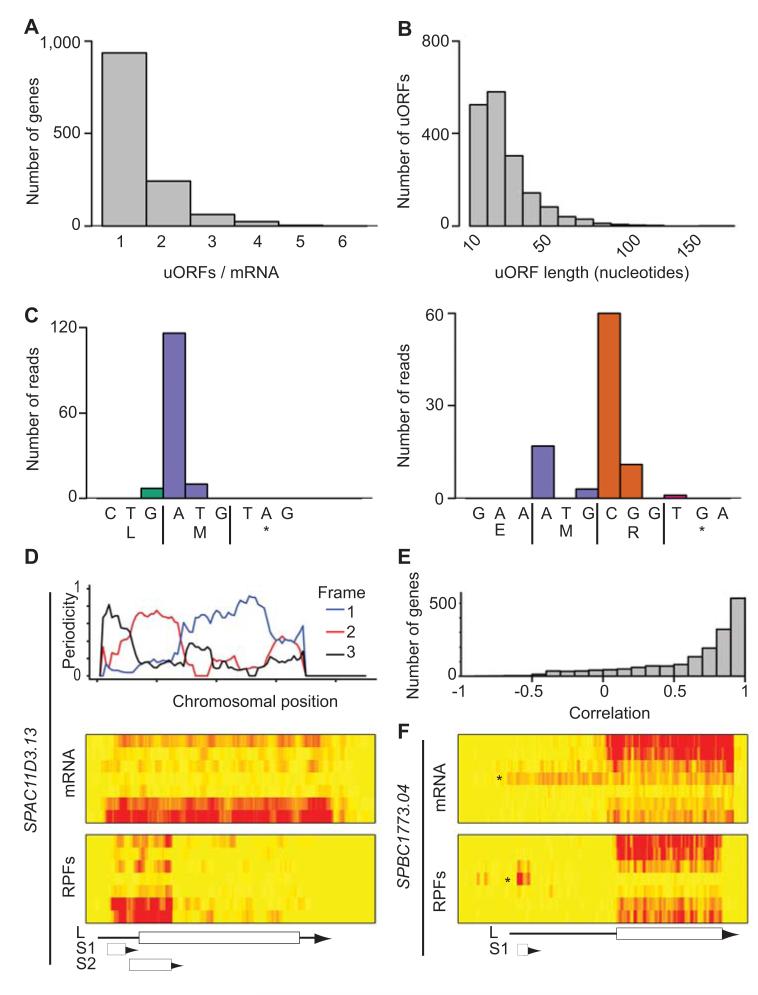
Figure 5. Identification and characterization of uORFs.
(A) Number of translated uORFs per mRNA. (B) Length distribution of all translated uORFs (in nucleotides). (C) Examples of very short highly translated uORFs. The x axes show the DNA and protein sequences of a uORF consisting of a single codon (left) or two codons (right). The y axis represents the number of reads at each nucleotide. (D) Translation of SPAC11D3.13. The top graph shows the triplet periodicity across the gene calculated for a running window of 35 codons. The heat maps show mRNA (top) and RPF levels (bottom) across the meiotic time course, starting with vegetative cells at the top and progressing downwards. The brightness of the red color is proportional to the number of reads. The scheme shows the position of the UTRs (arrows) and the ORFs (boxes). L corresponds to the annotated gene, S1 and S2 to predicted uORFs. Note the change in reading frame as the window moves from one ORF to the next one. S2 overlaps with L and is more heavily translated, and is thus the dominant frame. (E) Correlation coefficients between uORFs and their corresponding ORFs. (F) Translation of the SPBC1773.04 locus. Labelling as in D. L corresponds to the annotated gene. Note the presence of a longer form of the mRNA (star on the heat map that appears at the 5 hour time point and whose translation (box S1) correlates inversely with that of the downstream ORF.

