
Figure 2.
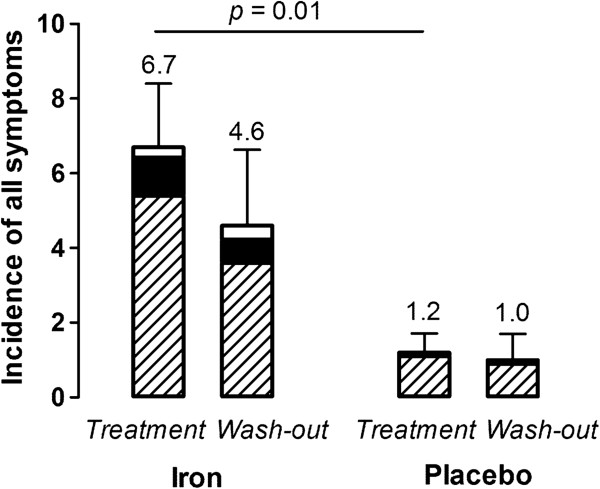
Mean (SEM) incidence per participant of symptoms, from ‘box C’ of the questionnaire, in in week 1 (treatment) and week 2 (wash-out) of the iron and placebo groups. The mean incidence of symptoms for the week as mild (stripped part of columns), moderate (closed) and severe (open) is shown.