
Figure 5.
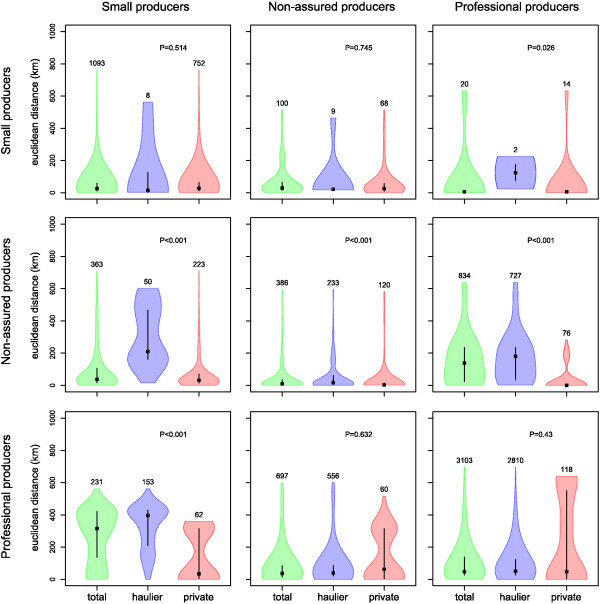
Distribution of Euclidean distances between producers, stratified by their producer types and their usage of a registered haulage company. Rows and columns represent departure and destination, respectively. For each panels, the three shapes represent the distribution of distances computed over all movements (“total”), all movements using a vehicle from a haulage company (“haulier”), and all movements using the vehicle from either the departure or destination (“private”). The thickness of the shapes indicates the probability density of the data, whereas the black box and solid line within each distribution indicate the median and interquartile range of the observed distribution, respectively. Numbers on the top of each distribution indicates the number of recorded movements. The P-value of the Mann–Whitney test comparing the distances recorded for movements using a haulier with those using producers’ own vehicles is also shown.