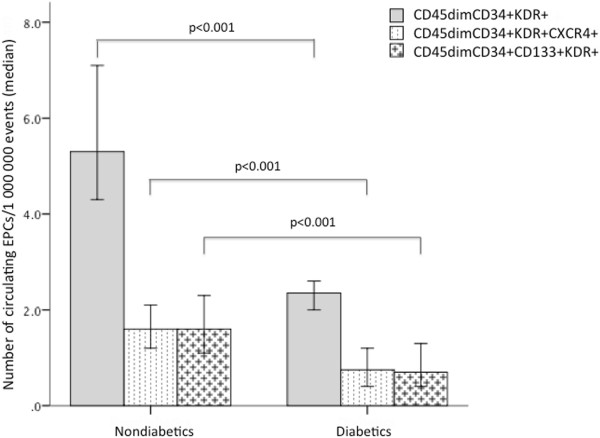
Figure 3.

Comparison of circulating EPCs levels between diabetics and nondiabetics. Bars represent median and error bars interquartile range of circulating EPCs numbers quantified by flow cytometry. Mann Whitney U test was used for the comparison between diabetic and nondiabetic EPCs levels.
