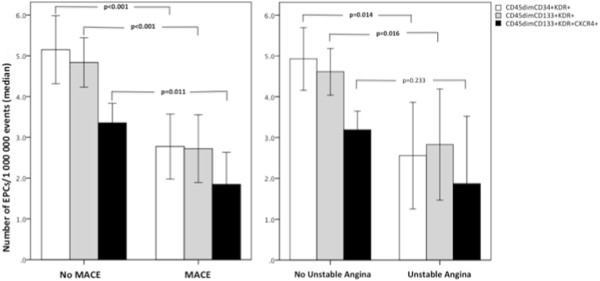
Figure 7.

Comparison of baseline EPCs levels between patients with or without cardiovascular events during the 2-year follow-up period. Bars represent median and error bars interquartile range of circulating EPCs numbers, quantified by flow cytometry within the first 24 h of admission. We compared EPCs levels between patients with versus without MACE (left panel) and between patients with versus without unstable angina (right panel), using the Mann Whitney U test.
